
I’m sure most of you are familiar with these charts by now; if not, check out this post. After the jump, what I see in the data, along with a map of the route. Continue reading “Ridership Patterns on Route 8”

I’m sure most of you are familiar with these charts by now; if not, check out this post. After the jump, what I see in the data, along with a map of the route. Continue reading “Ridership Patterns on Route 8”
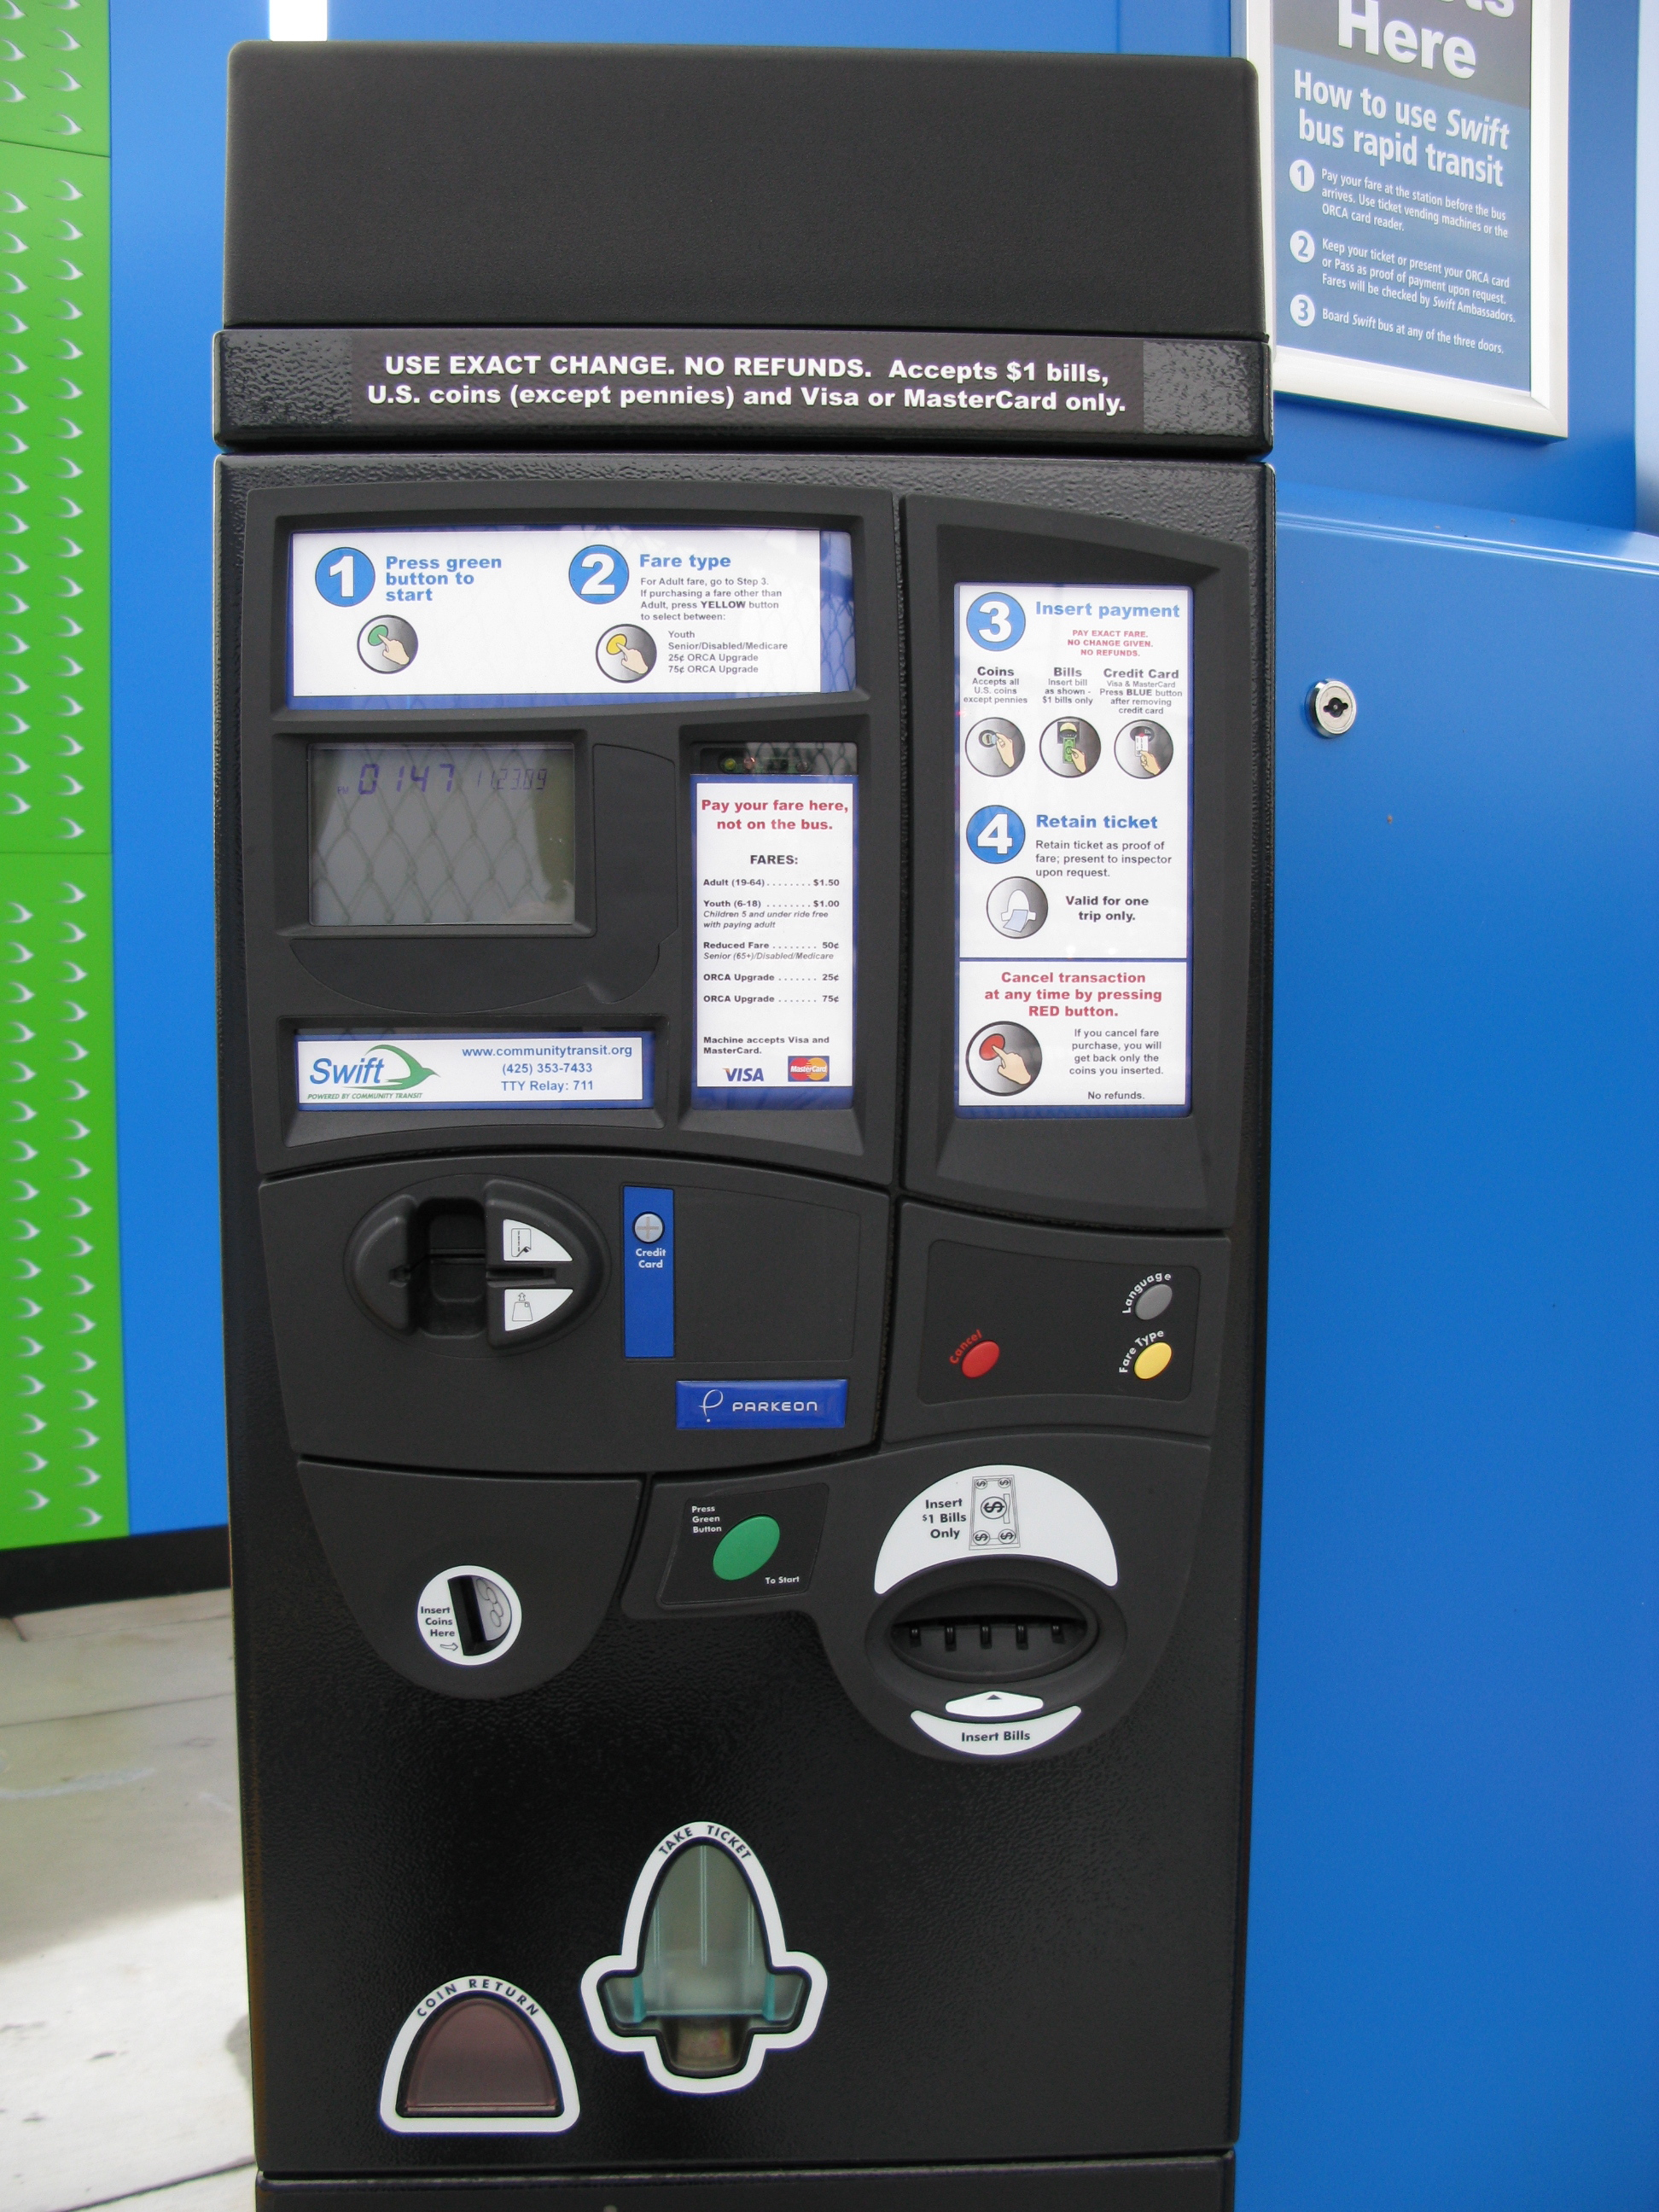
One mitigation measure suggested in Metro’s No Ride Free Simulation Study is “implementing ticket machines and/or ORCA readers at high boarding locations along Second, Third and Fourth Avenues.” The goal is to have passengers pay before they board the bus like on Link light rail or Swift BRT. When combined with a proof-of-payment (POP) system, the all door boarding benefit of the Ride Free Area can be retained.
The introduction of RapidRide C, D, and E Lines in the next two years would presumably bring ORCA readers and some kind of POP to the busiest Downtown Seattle stops. Ticket machines would allow cash payers to pay before boarding.
How much would the ticket vending machines (TVMs) cost? The $400,000 per year that the City of Seattle pays Metro for the RFA is enough to buy at least twenty Swift style ticket vending machines. That’s enough to equip every RapidRide stop within the RFA* with a TVM and for six other busy stops downtown.
I say at least twenty because I’m assuming a total cost per TVM of $20,000 based on Community Transit’s costs for Swift’s TVMs including spares, the management system, taxes, and contingency. The TVMs themselves cost $9,000 (accepts coins and cards) to $13,000 (accepts coins, cards and bills) per unit. I think there is potential for cost savings if Metro leverages the City of Seattle’s existing infrastructure which supports over 1,600 parking pay stations and off-board TVMs on the South Lake Union Streetcar.
I’m not suggesting that the city spend all $400,000 on ticket machines but merely pointing out how much that amount could buy. It’s not an insignificant amount. It isn’t a new concept either, hundreds of stops in Central London’s “cashless zone” have ticket machines for fare pre-payment since 2003.
*According to Metro’s maps there are 14 RapidRide stops in the RFA. Stop pairs are on 3rd Ave at Yesler, Cherry, Seneca, Pike, Virginia, and Bell. For C & D lines there are another two stops, on 2nd & Seneca and 2nd & Columbia. I’m not sure why the E Line (358) doesn’t have a stop at 5th & Jackson.
**Disclaimer: The author is currently employed by the City of Seattle. However, all opinions expressed in this article are completely his own and may not reflect the views of anyone else.
This post originally appeared on Orphan Road.
 You turn on a shower. Your hot water heater takes water that’s the same temperature as the ground (roughly 50F, depending on the season) and heats it up to around 120F. The water runs in pipes through your walls (losing some of this heat to the outside), then you mix it with some cold water to bring it down to 105 or so (an unnecessary increase of entropy, which wastes energy), it runs by your body once, then you dump almost all of that beautiful, expensive heat down the drain.
But King County Executive Dow Constantine, working with the FreeHold group, wants to take some of that heat you’re wasting and heat other buildings with it. They are also using ground source heat pumps, adding a smart grid, supplying district heat and cooling, recovering methane from landfill waste, harvesting rainwater, and even want to add a new Sounder station at Interbay. The entire Interbay project will be mixed use with offices, retail, and industrial all sharing the same campus and sometimes the same building.
Check the project out (PDF of features here, sales PDF here). Want to save some of that wasted heat yourself? Consider shower heat recovery. It’s just a coil of copper tubing around your shower drain, and pays back quickly for new construction, and in a reasonable number of years for many retrofit installations.

Yesterday Metro had a surprise event to award Federico “Fred” Banzuela the title of driver of the year (2010). Congrats Fred!
Metro’s press release below.
A U.S. Army veteran with a long history of service to his country and his county was chosen today as the King County Metro Transit Operator of the Year for 2010.
Federico “Fred” Banzuela, 61, is the latest in a long blue-and-teal line of bus drivers who demonstrate safe driving skills, exceptional customer service, and an outstanding overall work record. It is a peer award, with the winner selected by other Metro drivers.
“Fred is somebody who always has public service in mind,” said King County Executive Dow Constantine. “He served our country in the Army, including a tour of duty in Iraq six years ago. At Metro, he continues to distinguish himself every day in the level of service he provides to his bus riders and his co-workers.”
More after the jump. Continue reading “Bus Driver of 2010”

This is an open thread.

Some of you may find this trivial, but nomenclature can often play a big role in defining how a transit system is marketed and ultimately how it’s communicated to its customers. Take our transit center, for example– loosely defined as a hub where connecting services converge upon each other to serve one geographic concentration. Yet, you wouldn’t be able to easily extract this definition from the term itself.
To a non-regular rider, a transit center could convey something entirely different. In fact, a planner from Ottawa I recently spoke to was confused by our use of the term and wasn’t fully aware that it simply means a place where a lot of transit connects. Canadians will use ‘transit loop’ or ‘exchange’ to describe exactly the same thing. The latter is a term I’m personally a fan of because it literally describes movement from one medium to another. Ask someone what they think of when they hear the word “exchange” and they’ll likely say something about the NYSE or a marketplace of sorts.
Let’s be clear here– transit riders aren’t commodities to be shipped from route to route, they’re people. But they’re also customers that can cognitively capitalize on the utility of our nomenclature. If a “transit exchange” can convey things “transit center” can’t, then that’s the better card to play.
On May 31st the County Council adopted the fall service changes which we’ll see shortly. Included at the end of the press release was a handy summary of the service changes, detailing the change in service hours and how it relates to other changes.
The largest changes are coming to the Eastside with the launch of RapidRide B Line and the associate restructuring. Other changes include increased mid-day service on the 54 (RapidRide C Line as of next year), additional service across SR-520, and some TransitNow partnership service.
Check out the table below the jump. Continue reading “Fall 2011 Service Changes Details”

In a recent post, Martin made the case — based on his own experience, and the 2009 route-level data — for abolishing the underperforming and almost entirely redundant Route 42. I think that post and the subsequent discussion demolished any reasonable argument in favor of the 42 based on mobility (“mobility” meaning the idea that transit agencies should attempt to provide some service within walking distance of every urbanized part of their service area). In this post, I’ll discuss more recent stop- and route-level data.
 Now that I’ve beaten to death Seattle’s options for its three high capacity transit corridors (plus two in the center city), it’s time to look at what the other 12 corridors might look like in the Transit Master Plan.
SDOT and Nelson/Nygaard have not completed the plan, but they did brief the City Council on an example treatment, West Seattle’s Delridge corridor (slide 14). For a mere $1m in capital costs and $5m in annual operating costs, these street improvements could bring 2030 ridership to 6,600 per weekday, for a net increase of about 1,000.*
The cumulative changes save about 1.7 minutes on a typical trip end-to-end.
* Note: Nelson/Nygaard confirms the slide from which I got these numbers has a typo. The “annualized capital cost per ride” is not $35, but about 10 cents.
by ANN DASCH

Many companies practice price discrimination, charging different customers different prices for the same good or service to maximize revenue. Think of coupons, matinee movies, senior or bulk discounts. The Washington State Ferry System practices price discrimination. For instance, they charge senior passengers half the adult fare, and raise most vehicle fares in summer in response to increased seasonal vehicle demand.
When WSF had growing ridership, they charged school aged children half the adult fare, just like seniors. During several fare changes since 1998, WSF reduced the youth discount – as well as the bulk discount on the 10-ride passenger pass – to its present level of 20% off.
According to the Office of Financial Management, 16.2% of Washington’s children live in poverty compared to 7.7% of seniors and 11.7% of adults. Yet a child (age 6 to 18) pays 60% more than a senior (even non-residents) for the same ferry trip. It costs over 20% more for an adult to take a child roundtrip on the ferry than it costs that adult to take a motorcycle (non-peak, Cross Sound roundtrip). The youth discount is far too small. Increasing the youth discount could increase ferry fare revenue since families could better afford to take the ferry instead of driving around.
Instead of increasing the youth discount, WSF’s new fare proposal decreases the youth discount and the 10-ride pass discounts, while it maintains the senior passenger discount and actually lowers fares for some vehicles. Drivers of small vehicles (< 14’) will pay less than their current fare, and supersize vehicles (20’ to 22’ long) will pay less than half their current round trip costs if they use the multi-ride standard vehicle pass next summer ($21.14 versus $45.60 today). As of Fall 2012 October 2013, a senior driving a small vehicle Cross Sound westbound in winter will pay only 90 cents more than an adult walk-on passenger. This fare proposal will further discourage families from using the ferries while making ferry use cheaper for small vehicles and 20’ to 22’ vehicles – especially for senior and commuter drivers.
The ferry system has lost over 15% of its riders since 1999. Couldn’t the disproportionate fare increases on tickets purchased by families be a cause of those declines? The relationships between the fares matter. They influence rider behaviors, the mix of vehicles versus passengers, fare revenue collected, as well as the demographics of ferry dependent communities. Our government must fix the state’s ferry fare structure. The new plan makes it worse.
[Editor’s Note: The Washington State Transportation Commission is holding their final meeting on this subject Wednesday, August 24th, at 1pm in Belltown.]
Ms. Dasch serves on the Anderson Island Ferry Issues Study Committee. Anderson Island is served by Pierce County Ferries, not Washington State Ferries, although PCF tends to use WSF fares as a guideline.