Zach wrote for STB from 2010-2017, and was our inaugural Staff Reporter from 2015-2017. Zach has also worked for Pierce Transit, Commute Seattle, and owned a bike rental business. As of June 2017 he works at Sound Transit. Zach is a Beacon Hill resident and can often be found biking, riding Link, or driving his Seattle-cliche Subaru.
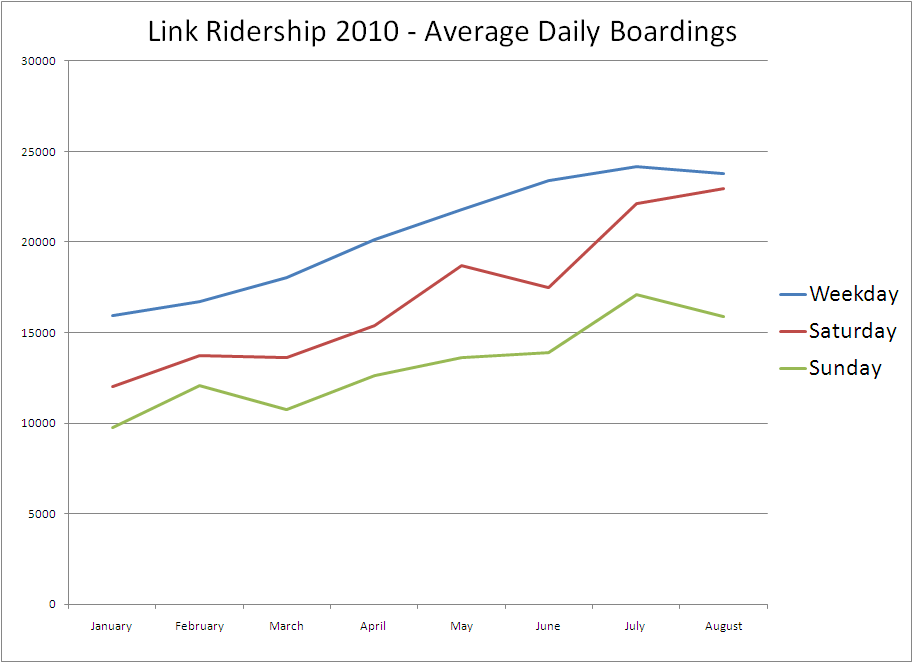
Weekday Link ridership declined slightly in August. The weekday average of 23,771 boardings was down 1.5% from July’s record count of 24,145. Sunday ridership declined a significant 7% (from 17,127 to 15,893) , while Saturday ridership was up by 4% (from 22,098 to 22,979).
While perhaps disappointing, most of us expected an August lull of just this sort. The cruise ship and general tourist markets were on the wane, and schools had not yet begun in earnest. Looking into the autumn, the smart money is on increased ridership in September and October to be followed by another leveling-off or decline in November.
I thought I’d follow up on Martin’s post on Amtrak’s long-distance reliability numbers with some Cascades data that is highly relevant to the conversation. Commenters expressed frustration with using mean performance as a single indicator of success, and many asked not only for Amtrak’s definition of ‘on-time’, but also to see median, mode, and ‘full-distribution’ data for Amtrak trains. The problems with ‘mean performance’ have already been kicking around the transit blogosphere lately, and I see little reason to simply reiterate something others have already said well. But I always find it useful to add data and visuals to a conversation.
By Amtrak’s on-time performance definitions, trains can be 10-30 minutes late (depending on route distance) and be considered ‘on-time’. With such a wide scope, the concepts of ‘on-time’ and ‘reliability’ begin to drift apart in meaning. Reliability should mean a consistent travel experience, both qualitatively (comfort and service) and quantitatively (speed and on-time performance).
Check out the chart above. Using data from the invaluable Amtrak Train Status Archives, I charted the performance of two morning train segments (#510 Seattle to Vancouver BC, and #513 Vancouver BC to Seattle only) for January 1-June 30 2010.
Critics of transit investment – especially rail investment – frequently cite a failure to achieve a budgeted ridership estimate as evidence of the ineptitude or corruption of the agencies planning the lines in question. While I never wish to discourage due criticism, ridership estimates are constructed via theoretical models, and critiquing a model for being wrong is tautological, akin to critiquing a human for being mortal. Frustrated at popular confusion over the nature of modeling, I thought I’d write a post on the limitations and capabilities of models. To my mind there are four main points:
Work continues on King Street Station. The remnants of the baggage area and the Jackson St. Plaza have been demolished. (Slideshow above, picture of the ’empty hole’ here.)
Amtrak Cascades ridership between Seattle and Vancouver BC set a record in July, with nearly 25,000 total passengers for the four daily trains. Ridership is also up 21% on the original trains (510/517). CBSA has apparently reached a decision whether or not to continue free inspection services, and will be notifying WSDOT shortly.
To celebrate the popularity of the service (and to put timely pressure on CBSA?), Tourism Vancouver has partnered with Amtrak to offer 25% off Cascades travel between Seattle and Vancouver BC for all of September, along with discounts on hotels and city attractions.
Leveling and grading work has begun on the new 3.2 mile bypass track in Vancouver, WA.
WSDOT and BSNF have received approval to begin work on the Stanwood siding. On August 17 the Army Corps of Engineers issued the necessary wetland permit, the last major environmental hurdle.
WSDOT has applied for $80m in additional high-speed rail grants available under the $2.3b USDOT Appropriations Act. A 20% local matching commitment was required in order to apply.
Sound Transit announced plans on Tuesday to construct approximately 277 additional bicycle parking spaces over the next 16 months. Funded by federal grants, the 173 lockers and 104 rack spaces (13 racks, 8 spaces per rack) will be placed at selected park & rides, Link stations, and Sounder stations.
Cycling investments such as these are some of the easiest and most cost-effective means of combating the ‘last-mile’ problem, especially at far flung suburban park & rides. For a cost of $464,000 (or $1,675 per space) they’re not exactly cheap, yet they cost a tiny fraction of the same number of car spaces and they leave a small physical footprint on station areas. Anything that makes non-SOV multimodality more attractive has our support.
The locations are:
Auburn Station, 28 lockers
Columbia City Station, 7 lockers and 2 racks (2010), and 46 more lockers and 1 more rack (2011)
Due to a fatal accident between Puyallup and Tacoma, Sounder service is delayed over an hour and trains are being turned at Puyallup. It is unknown at this time if Cascades trains will run as scheduled to Portland.
Also, no trains will run to Vancouver BC today or tomorrow as emergency repairs in White Rock continue.
Following up on our recent discussions of frequency mapping (see Martin’s post here and Jarrett’s post here), I thought I’d share a frequency schematic for all intercity and commuter rail service available in California, Oregon, Washington, and the BC Lower Mainland. As we push to develop our rail networks it is imperative that we strike the right balance between vision and process; with too much of the former we lose ourselves in the foaming muddle of railfans (I say this as a railfan), while with too much of the latter we succumb to the sort of stale incrementalism with which we’re all very familiar. One of the most important requirements for speaking intelligently about our rail networks is knowing exactly what we already have, for this is what we will build upon. To that end I share this draft map I’ve been working on.
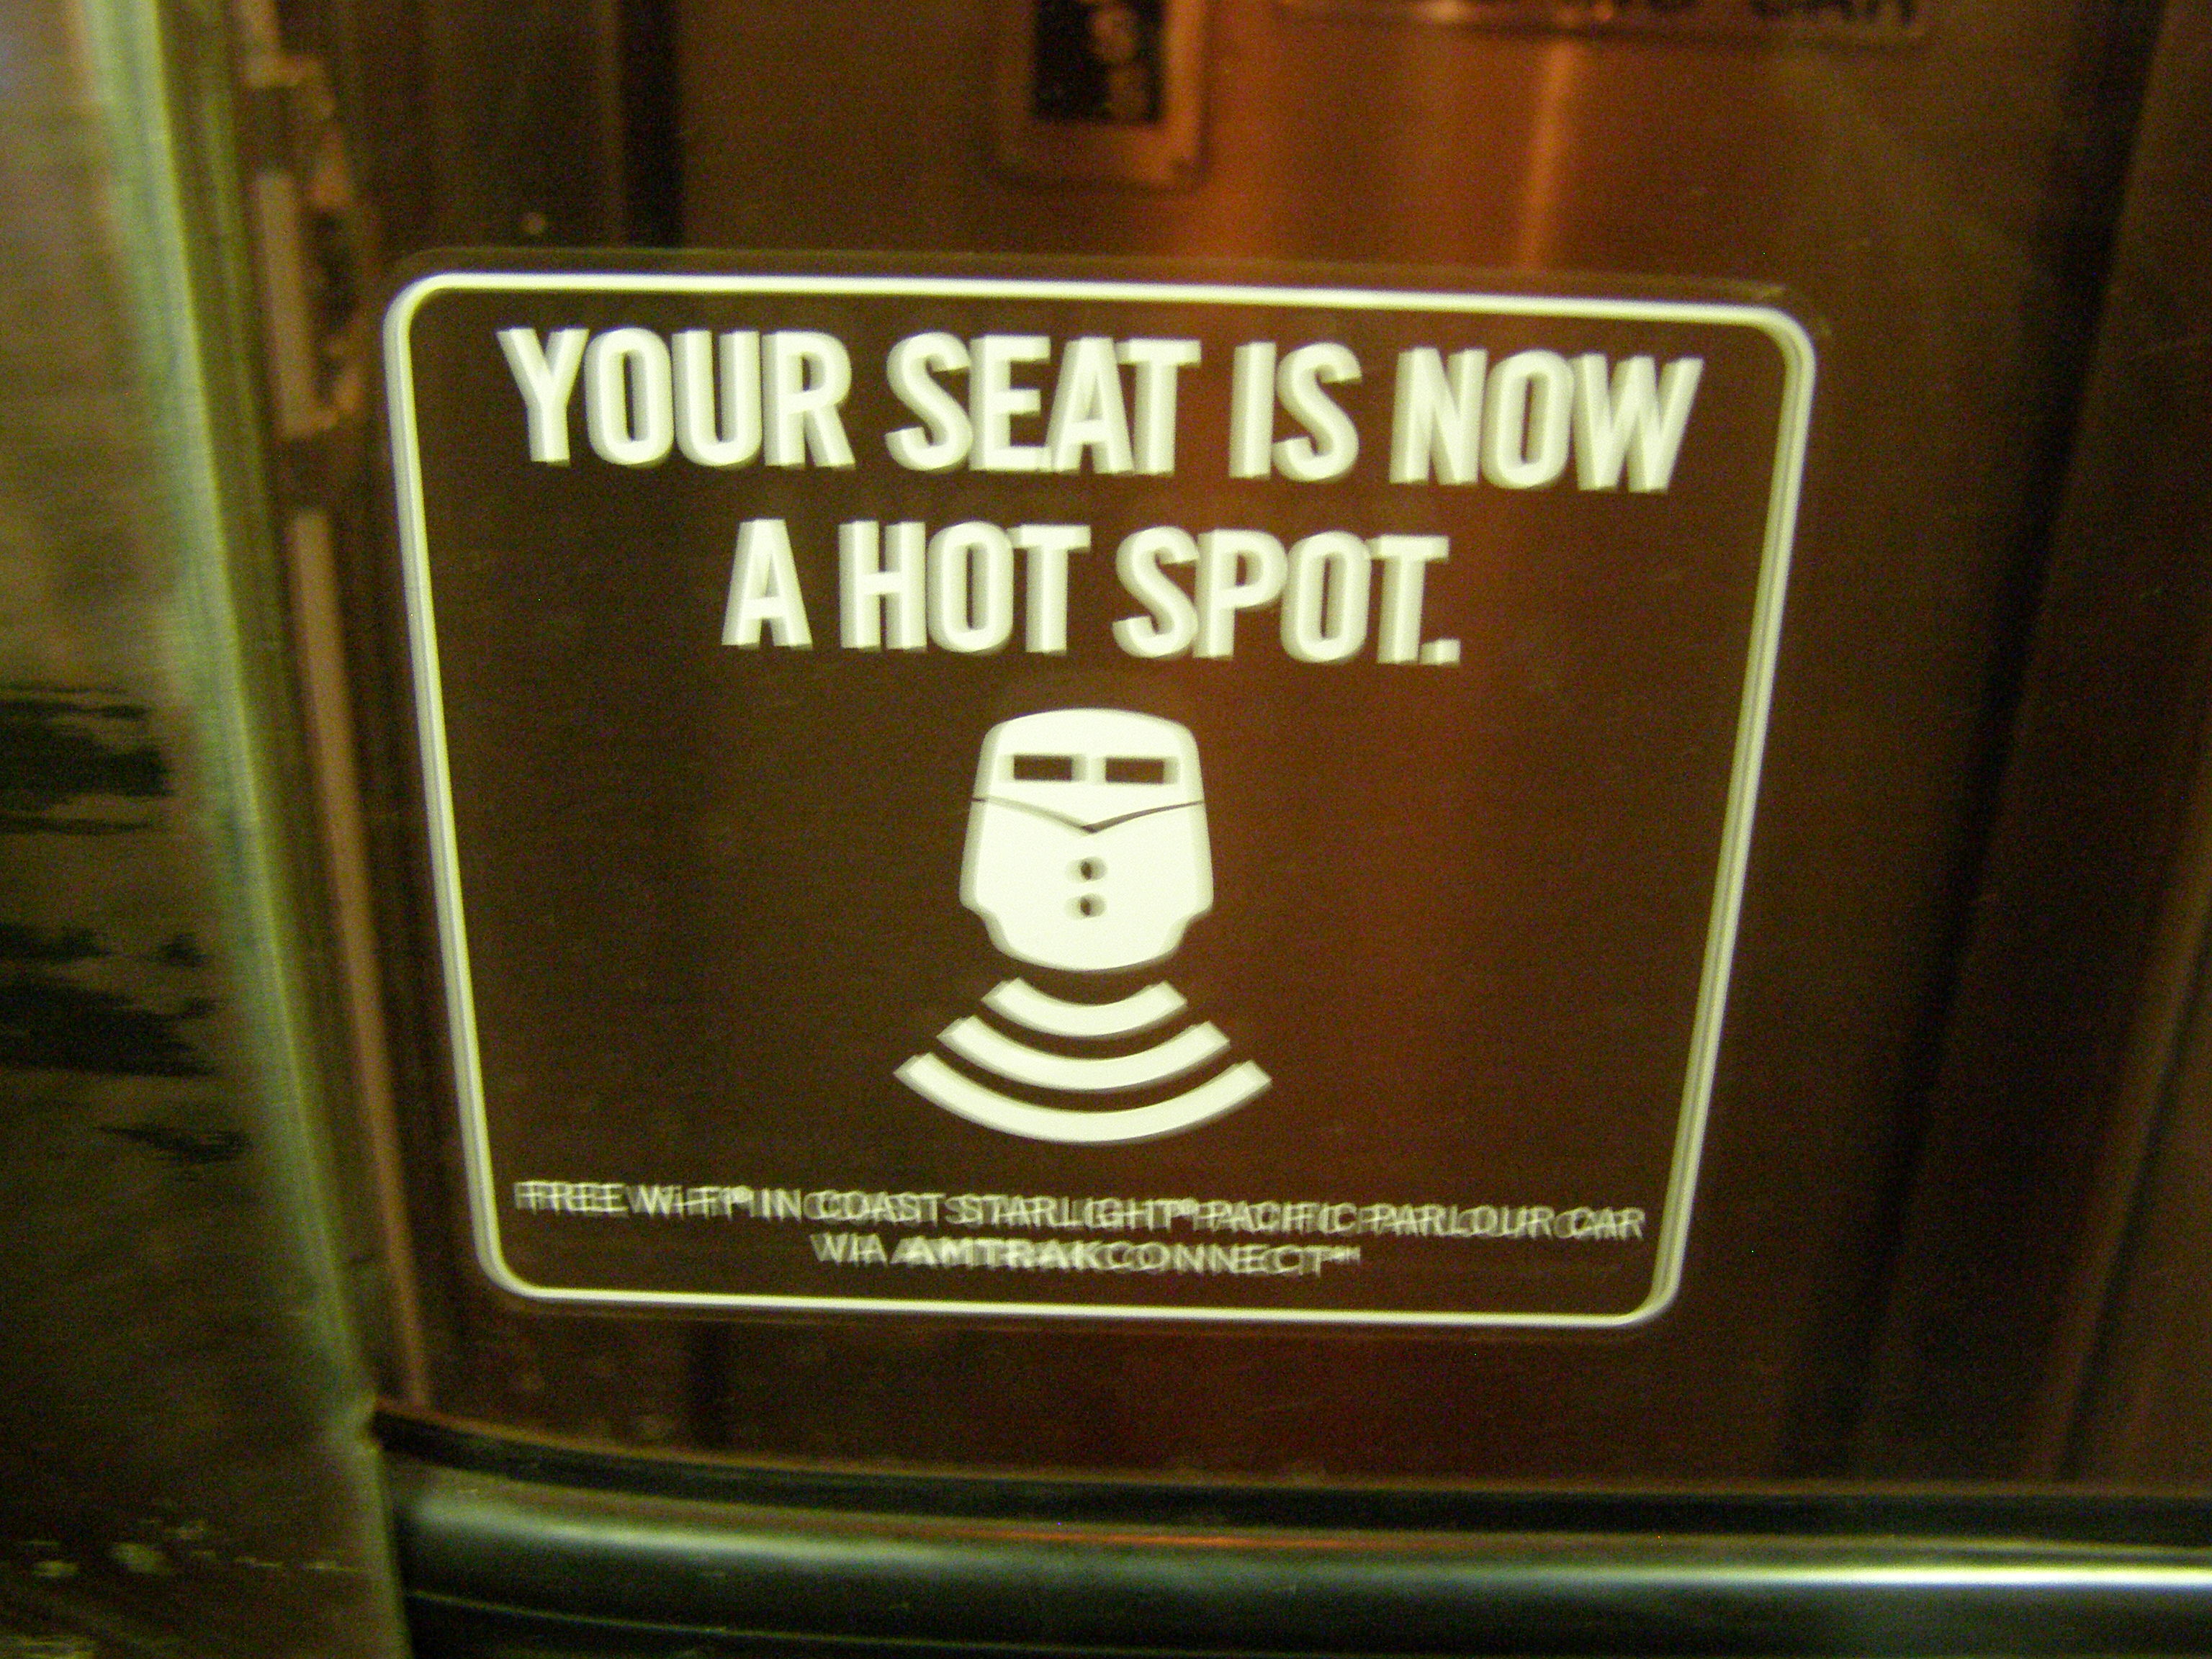
Two weeks ago I traveled from Seattle to Los Angeles aboard the Coast Starlight. Since the dark ages of 2005-2006, during which the train was late 90+% of the time, the Starlight has done much to reclaim its status as a premier passenger train. After a mudslide knocked out service in the winter of 2008, Amtrak ‘relaunched’ the service with a renewed focus on amenities and on-time performance, and it has worked. In June 100% of southbound trains arrived into Los Angeles on-time, while 93% of northbound trains into Seattle arrived on-time. My own trip confirmed this improvement. For $220 I had an on-time arrival, wireless internet, bottomless coffee and fresh produce, simple but decent meals, tablecloth service with porcelain dinnerware and real flatware, a small but comfortable room, a hot shower, leather lounge chairs, a cinema, and a panoramic view of Mount Rainier, the Tacoma Narrows, the Nisqually River Delta, the Columbia River, the Willamette Valley, the Oregon Cascades, Mt. Shasta, the Sacramento/San Joaquin Delta, and the Central Coast of California.
Somewhere Between Lompoc and Santa Barbara
Though we often discuss how well-developed passenger trains can take modal share away from car and air travel – and Cascades has a good chance of evenly splitting the air-rail market over the coming years – long-distance trains are qualitatively different. They offer neither the on-off freedom of cars nor the speed of airplanes. They are often the only high-capacity transit service available across a large swath of rural America and they traverse scenic pre-Interstate corridors. Being a functionally unique service, long-distance trains compete only against themselves and their own expectations, and they will live and die on the strength of the experience they offer. Amtrak seems to have belatedly figured this out, and the Starlight is again a wonderful experience. It’s not the ‘Star-late’ anymore.
As a footnote, I think Seattle and Portland have largely not recognized that we have arguably the highest quality Amtrak service in the country. We’re not a hub like Chicago, nor do we have the frequency of the Northeast or California, but we have the two best long-distance trains and a unique corridor service with Talgo equipment everyone else would love to have. While in many ways Seattle is behind the curve, we can at least be grateful for the high quality of service we enjoy.
We talk a lot on this blog about why people drive. Frequent points are made concerning perceived freedom, the motorist’s willingness to “pay time to save money”, the undercapitalization of transit infrastructure, the low marginal cost of individual driving trips once a car is owned, the modal lock-in caused by low density development, etc, etc…
But I’ve been especially frustrated lately by 3 perverse incentives that don’t get as much press:
Link ridership set another record in June, with an average weekday ridership of 23,396 (Saturday 17,510; Sunday 13,919), and a daily range of 9,827 to 28,820. This represents a 7.5% increase over May’s average of 21,774, and a 16% increase over April’s 20,129. June represented the sixth straight month of >5% month-over-month growth. Even with the usual caveats regarding sampling and modeling error, this is very encouraging news.
Ridership tends to follow a logistic growth model, in which ridership grows exponentially until it slows as it approaches a theoretical saturation point. We’ll probably see ridership stabilize at its “natural level” well before University Link restarts the growth cycle, but it will be exciting to see just what that level is. In the meantime, even with seasonal variations, we are likely to see continued year-over-year growth. (Just for fun, a continued 7% rate of growth would yield ridership of 35,000 by the end of the year.)